Dynatrace
Before you begin
This page assumes you have followed the rest of the steps to set up CV. To learn more, go to Configure CV
Add Dynatrace as a health source
This option is available only if you have configured the service and environment as fixed values.
A Health Source is basically a mapping of a Harness Monitored Service to the Service in a deployment environment monitored by an APM or logging tool.
Define Health Source
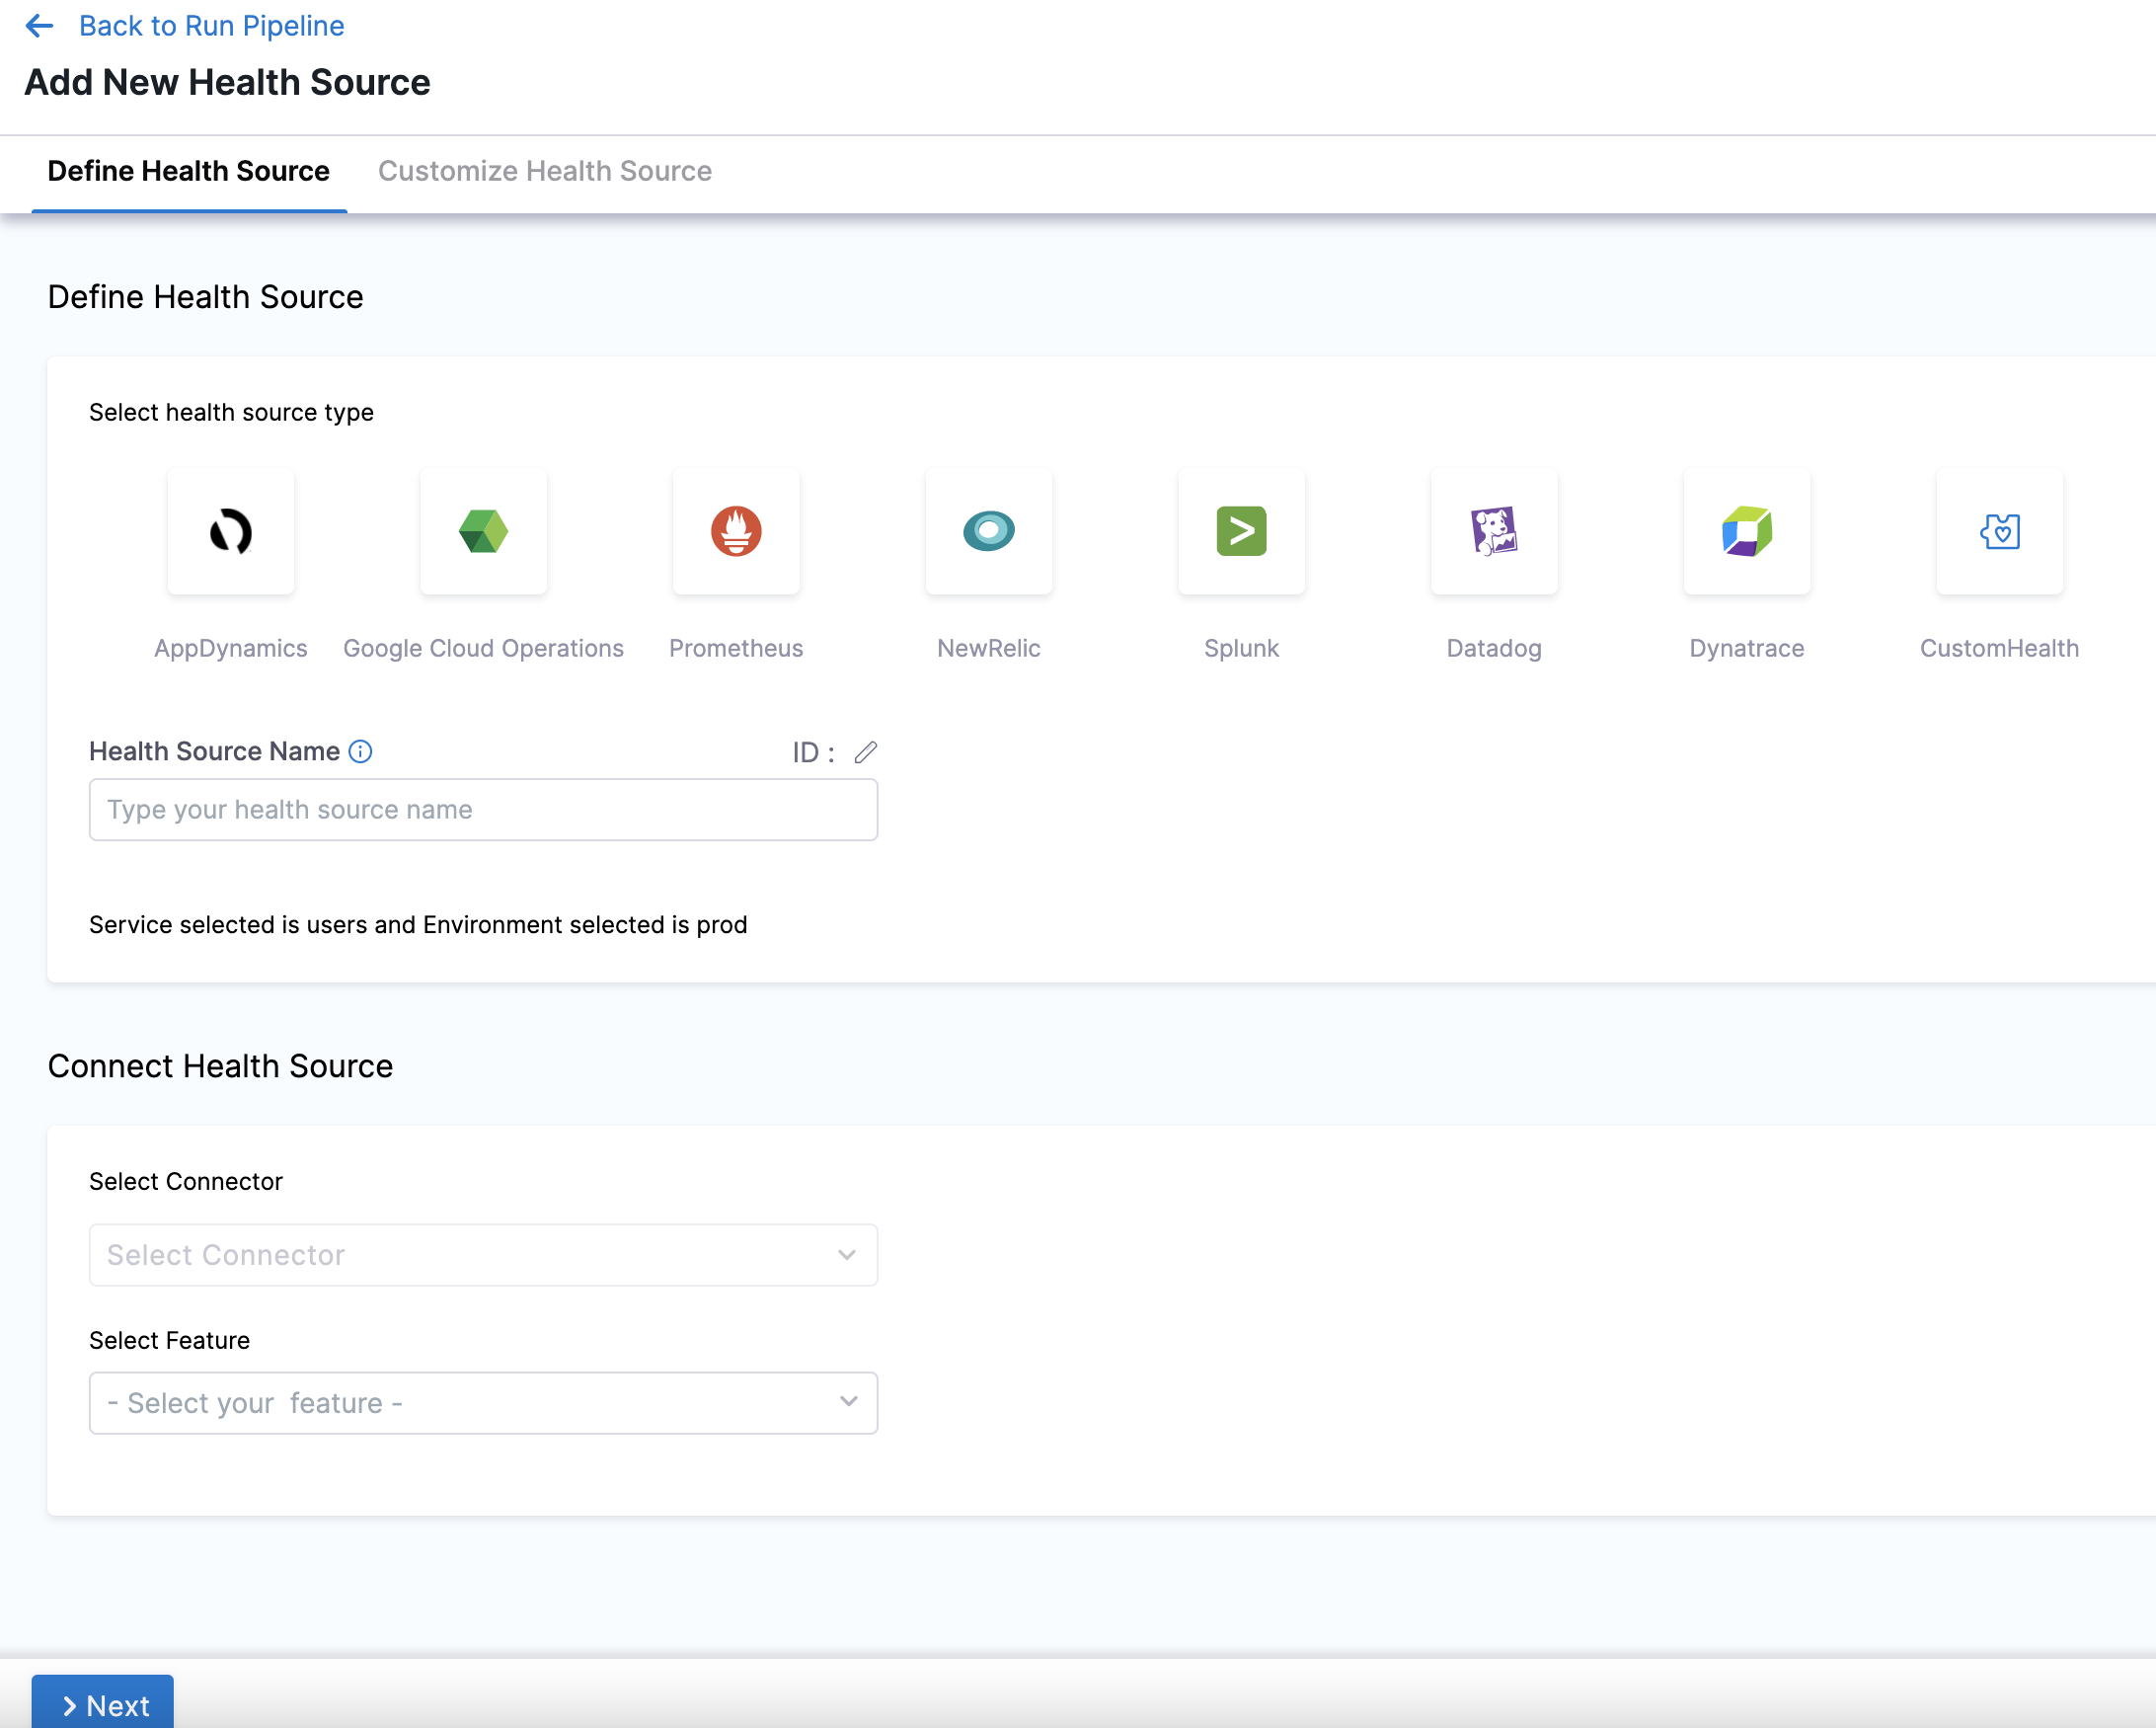
In Health Sources, click Add. The Add New Health Source settings appear.
-
In Select health source type, select Dynatrace.
-
In Health Source Name, enter a name for the Health Source. For example Quickstart.
-
Under Connect Health Source, click Select Connector.
-
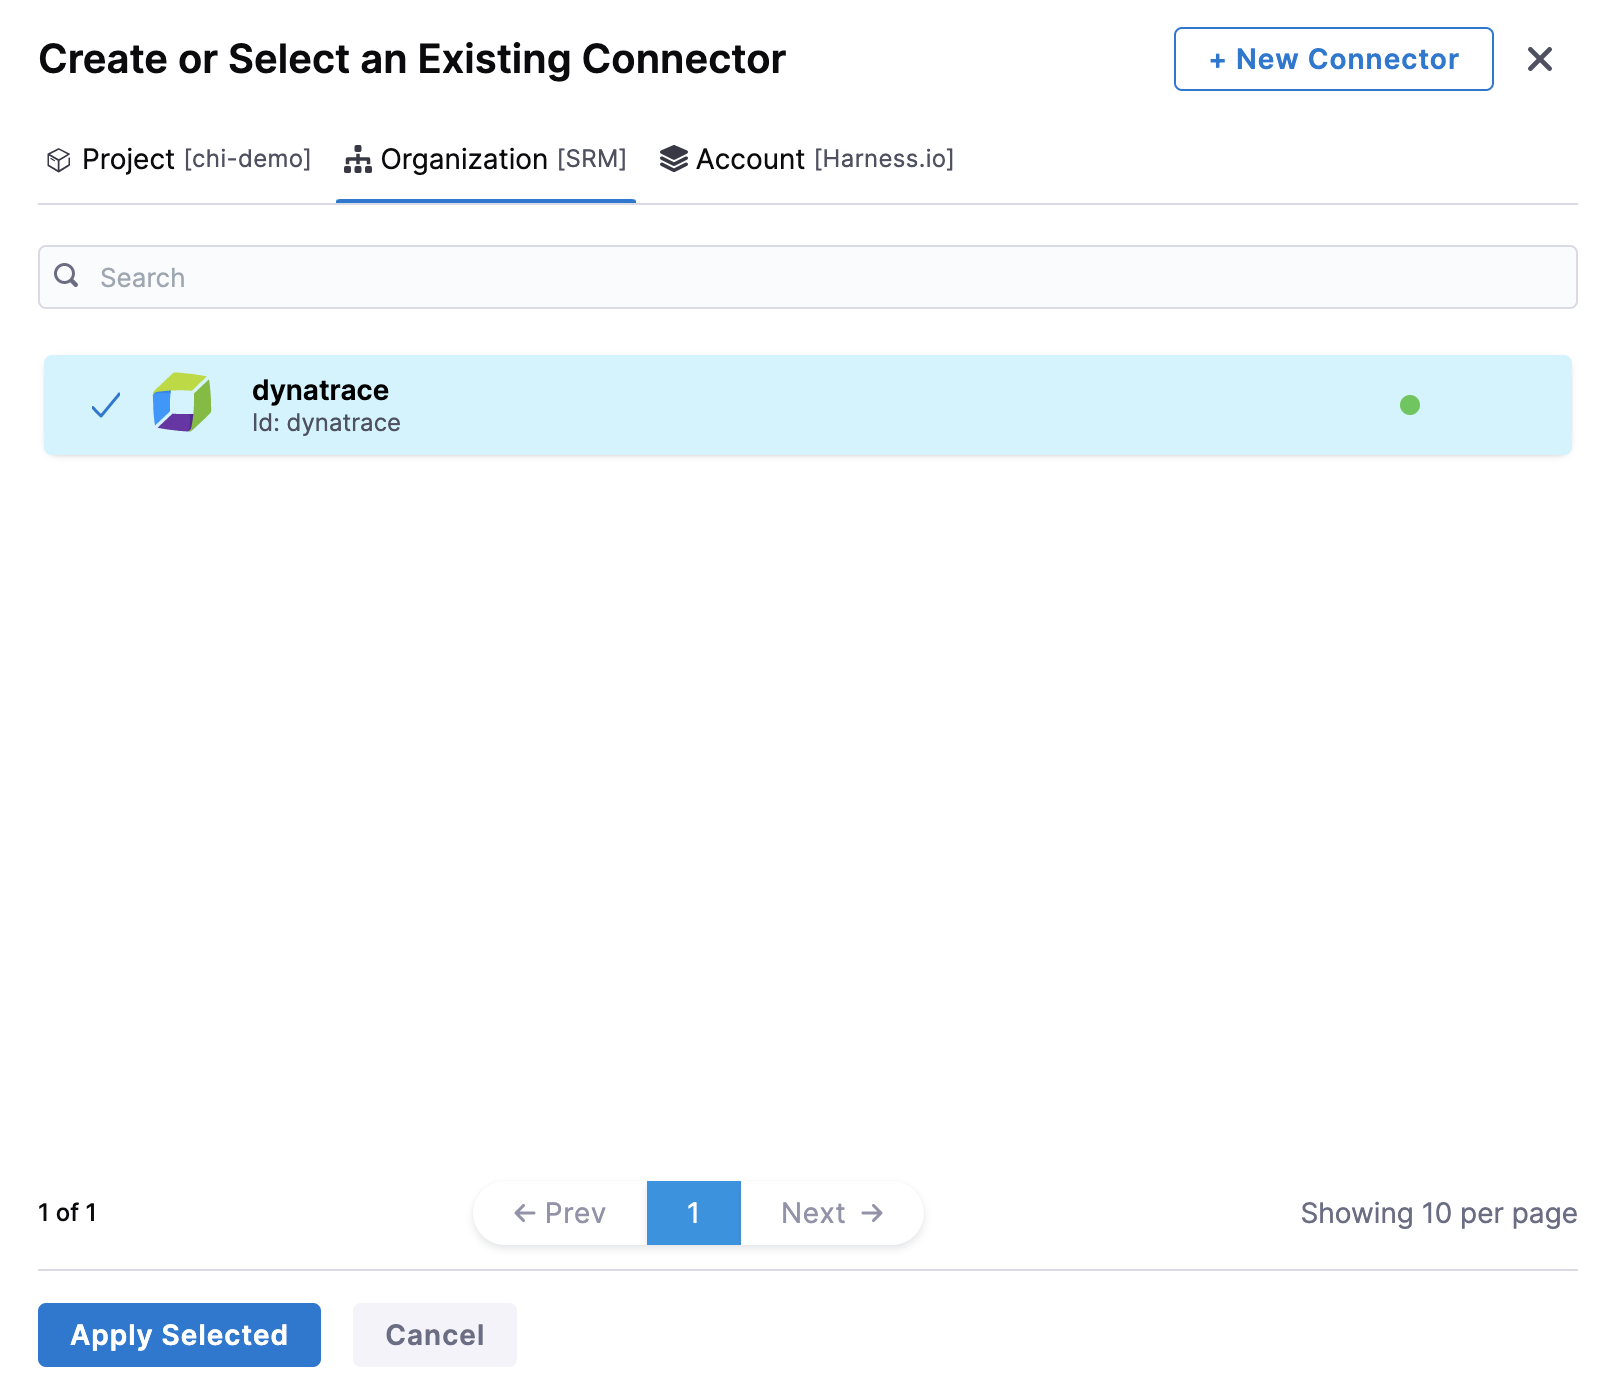
In Connector settings, you can either choose an existing connector or click New Connector to create a new Connector.
-
After selecting the connector, click Apply Selected. The Connector is added to the Health Source.
-
In Select Feature you can either choose Full Stack Observability: APM or Dynatrace Grail Logs. Your choice here will change which configuration options you see next.
Dynatrace Grail Logs are behind the feature flag CDS_CV_DYNATRACE_GRAIL_LOGS_ENABLED. Contact Harness Support to enable it.
Configuration
Depending on your feature choice, do the following configuration steps.
- Full Stack Observability: APM
- Dynatrace Grail Logs
-
Click Next. The Configuration settings appear.
-
Next, you will have the choice between using Metric Packs or Custom Metrics.
Choose Metric Packs if you want to use one of the predefined Infrastructure or Performance packs. Choose Custom Metrics to make your own metrics against your data.
You may choose both options.
- Metric Packs
- Custom Metrics
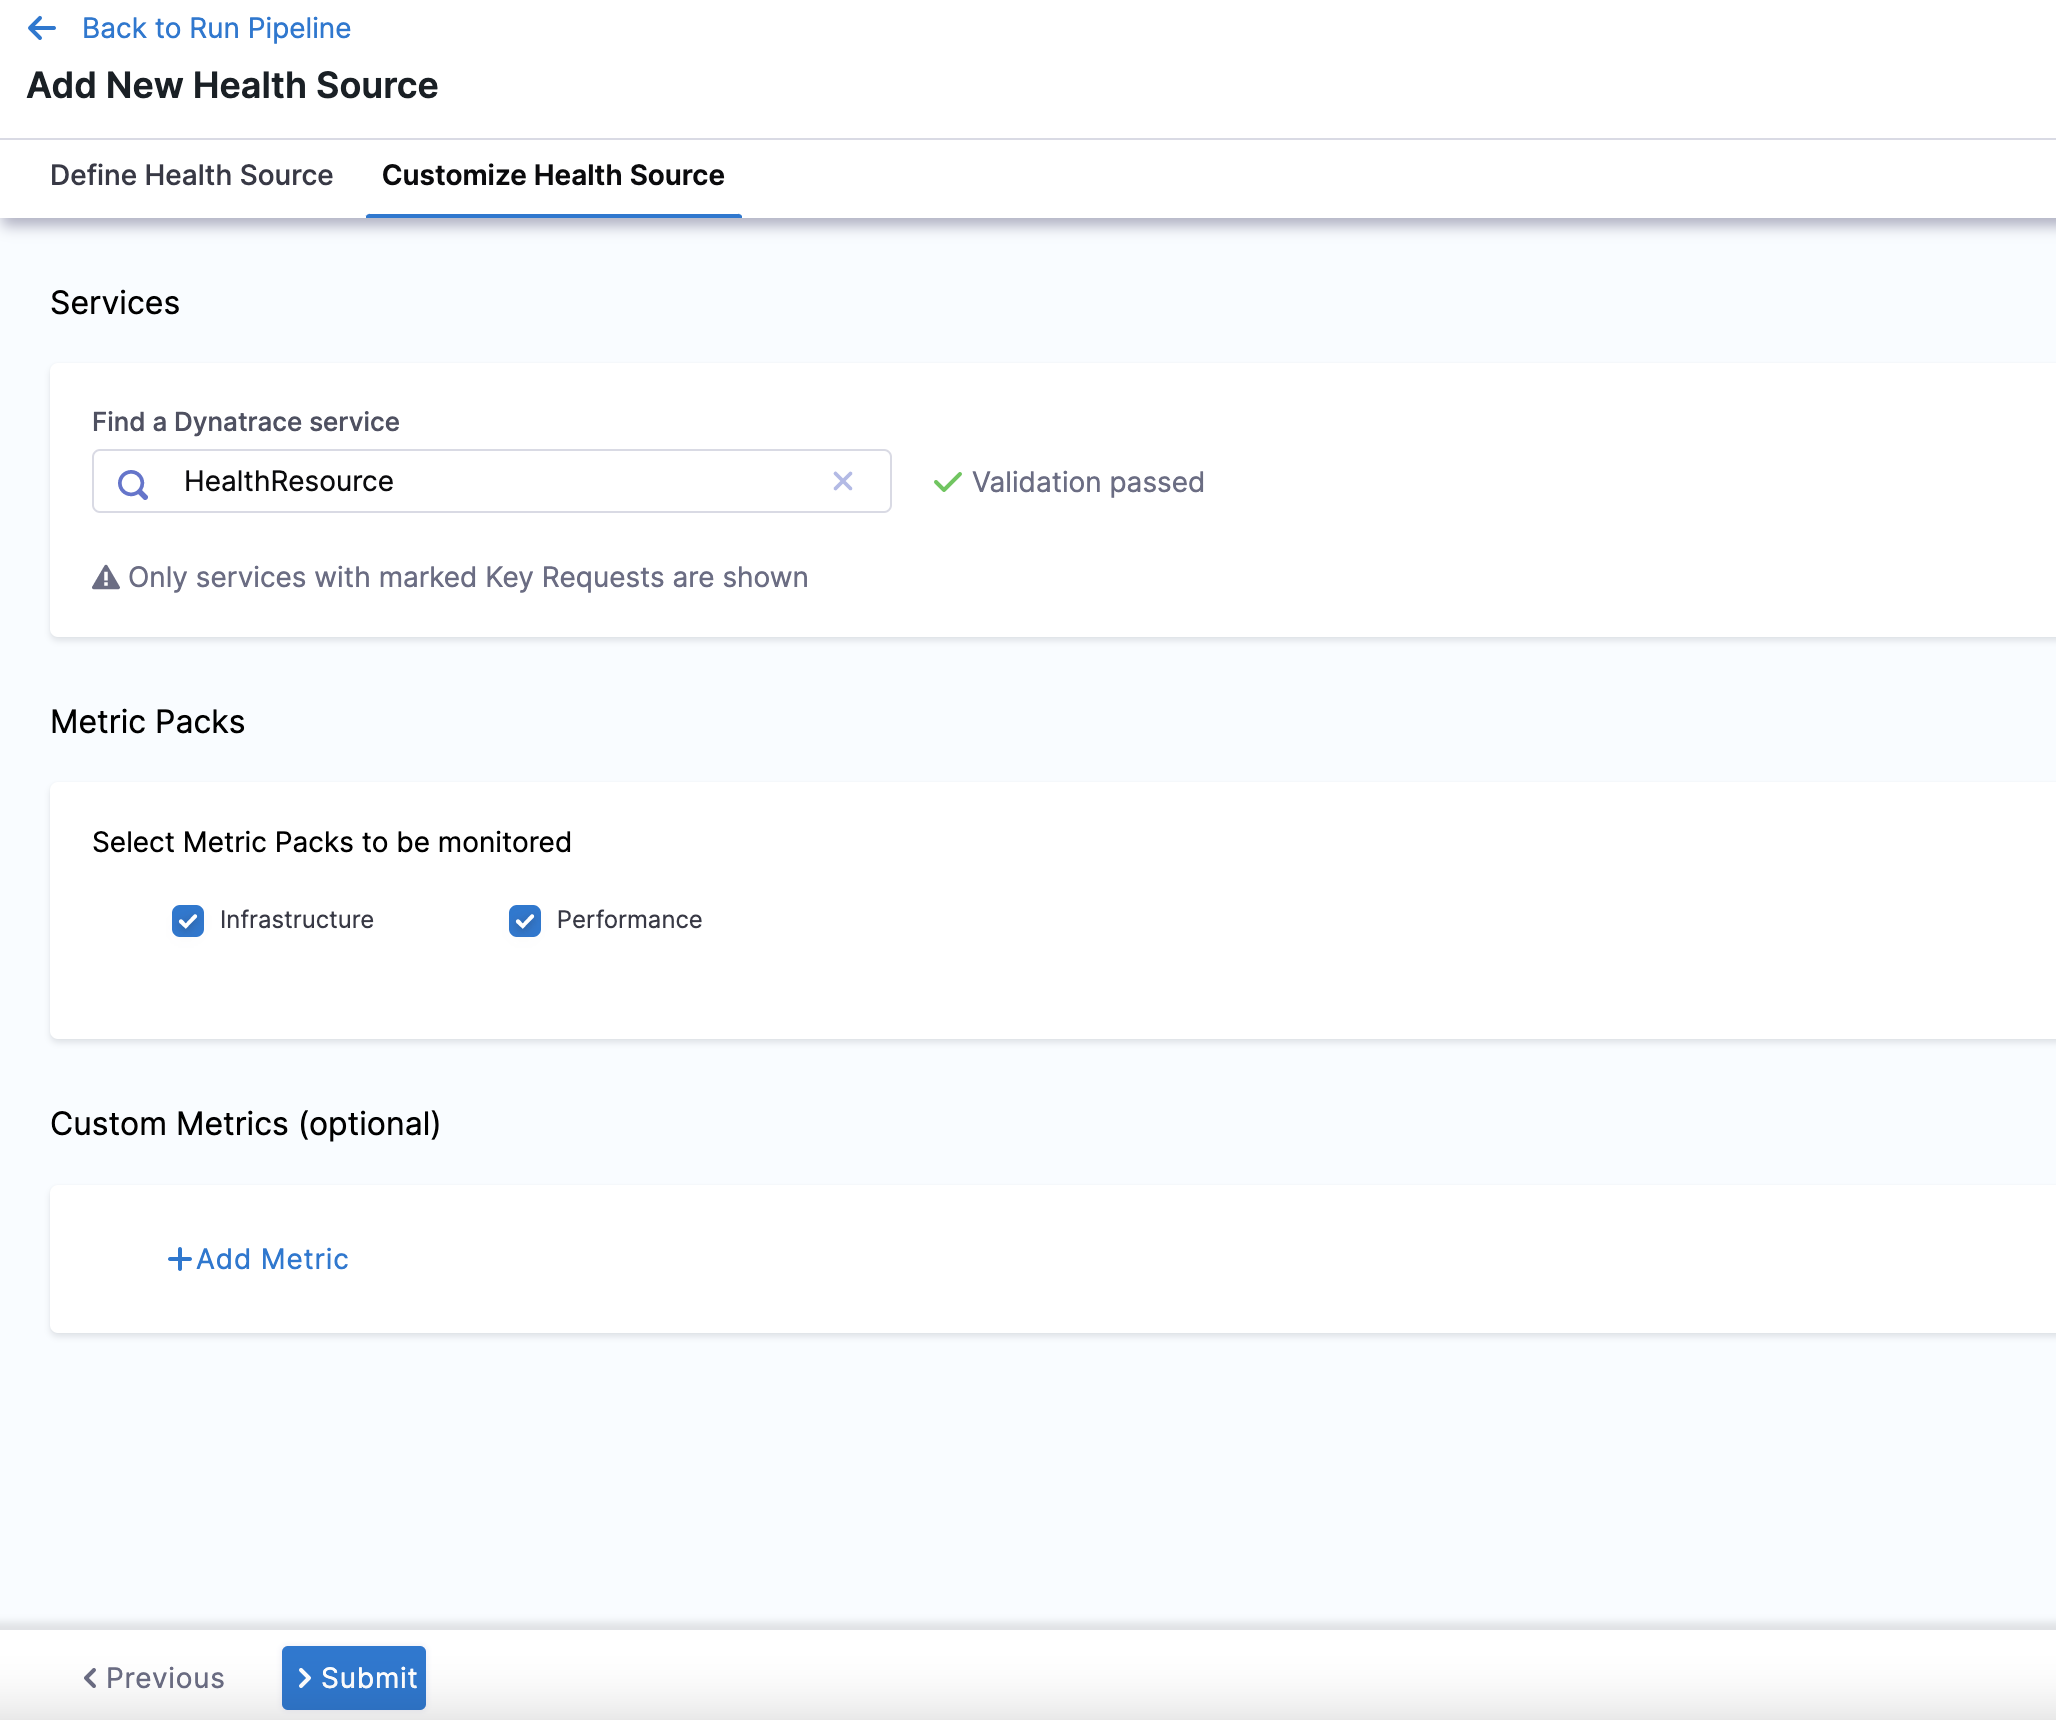
- In Find a Dynatrace service, enter the name of the desired Dynatrace service. This Dynatrace service must be marked as a key request in order to appear in this dropdown menu.
- In Select Metric Packs to be monitored, you can select Infrastructure, Performance, or both.
-
Click Add Metric if you want to add any specific metric to be monitored (optional) or simply click Submit.
-
If you click Add Metric, click Map Metric(s) to Harness Services.
-
In Metric Name, enter the name of the metric.
-
In Group Name, enter the group name of the metric.
-
Click Query Specifications and mapping. To build your query, do the following:
- In Metric, choose the desired metric from the list.
- In Select Metric Filter, choose the desired entity from the list. This will filter your metrics using entitySelectors.
noteSelecting metric filters is behind the feature flag
CDS_CV_DYNATRACE_CANARY_ENABLED. Contact Harness Support to enable this feature.- Click Fetch Records to retrieve data for the provided query.
-
In Assign, choose the services for which you want to apply the metric.
If you select Continuous Verification or Service Health, you will need to configure a risk profile. Expand the following block to learn more.
Risk Profile settings
Risk Profile
The Risk Profile section is only visible if you have selected Continuous Verification (Applied to the pipelines in the Continuous Deployment) or Service Health in the Assign section.
- Under Risk Category, select one of the following options:
- Errors
- Infrastructure
- Performance/Throughput
- Performance/Other
- Performance/Response Time
- Under Deviation Compared To Baseline, select the following settings to measure your service's behavior and calculate deviations from the health source:
-
Higher counts = higher risk
-
Lower counts = higher risk
Note that you can select multiple options.
Map service instance identifier
The Map service instance identifier (SII) section is only visible if you have selected Continuous Verification (Applied to the pipelines in the Continuous Deployment) in the Assign section.
In Service Instance Identifier (only needed for CV), specify the service instance identifier, which represents a dynamically created service that you deploy using Harness. The default value is _sourceHost.
When doing canary deployments, ensure that the SII can be used to identify the canary instance of the service, or CV will not work properly."
For Dynatrace, the only possible values of the SII are your entity selectors.
The ability to set a SII is behind the feature flag CDS_CV_DYNATRACE_CANARY_ENABLED. Contact Harness Support to enable this feature.
Finally, Click Submit. The Health Source is displayed in the Verify step.
You can add one or more Health Sources for each APM or logging provider.
This feature is behind the feature flag CDS_CV_DYNATRACE_GRAIL_LOGS_ENABLED. Contact Harness Support to enable it.
-
Click Next. The Configuration settings will appear. You should see one button, + Add Query.
-
Click + Add Query.
-
Choose a Query name and click Submit.
-
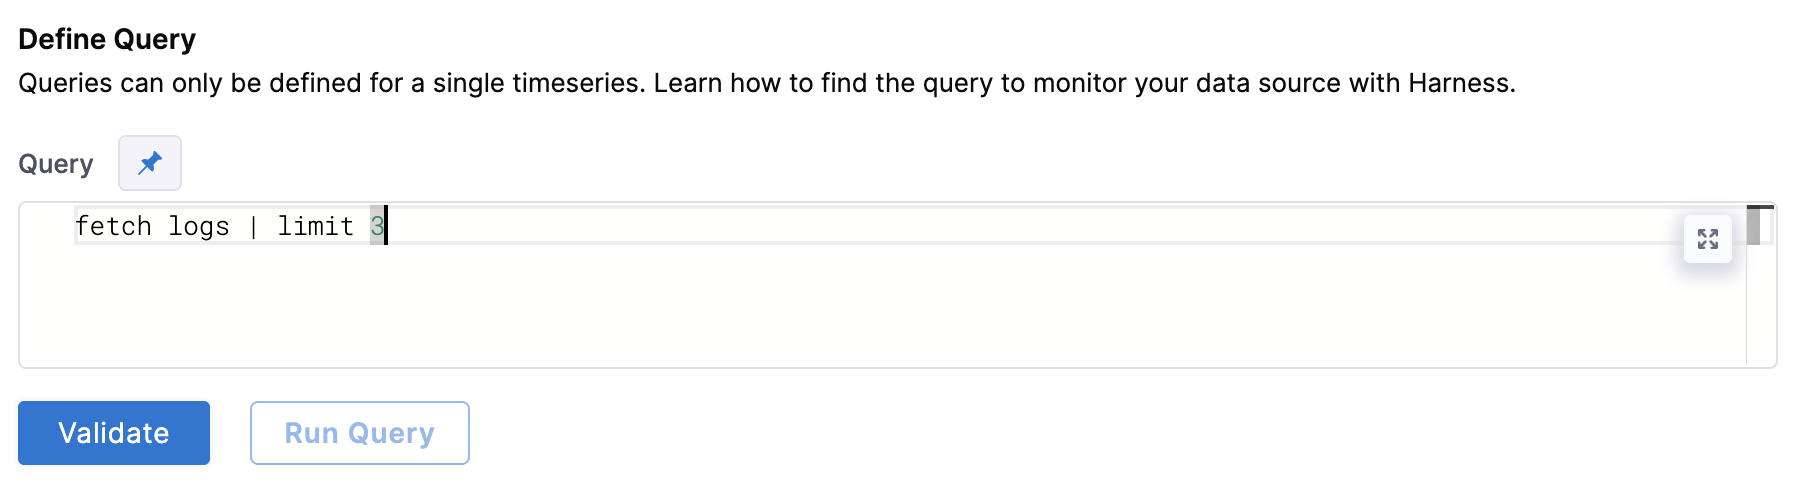
Under Define Query, enter your query. This query can also be a runtime input or expression.
-
After writing your fixed input query, click Validate to ensure your query is valid.
-
Then click Run Query. The query must be validated first from the previous step.
-
Next, complete the field mapping for the Timestamp Identifier, Service Instance Identifier, and Message Identifier. To do so, hit the
+button icon and select the relevant field from the log that appears.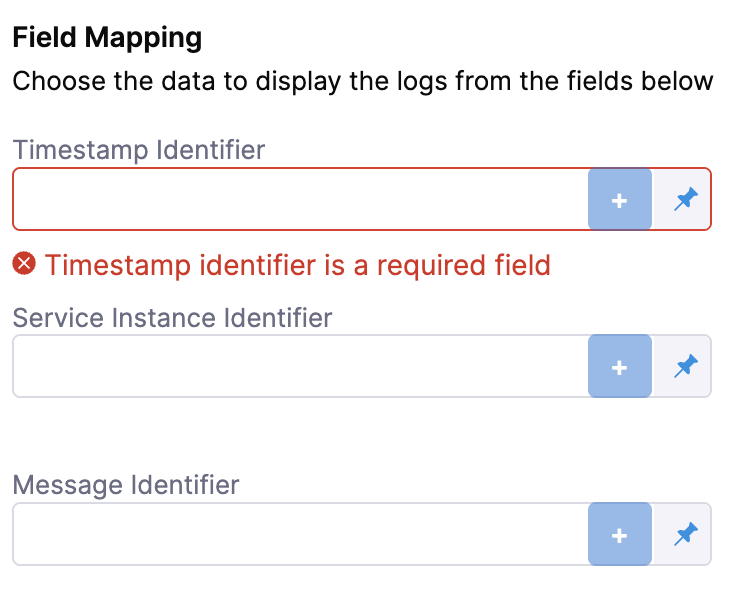
-
Click Submit. The health source is displayed in the verify step!
Sample Dynatrace queries
Latency
- Latency trend over time:
timeseries(avg(response.time)) - Latency distribution:
histogram(response.time) - Latency by application version:
avg(response.time) by application.version - Latency by geographical region:
avg(response.time) by geoip.country_name - Latency spike detection:
spike(response.time) - Latency comparison between environments:
avg(response.time) by environment - Latency by HTTP method:
avg(response.time) by http.method - Latency by service:
avg(response.time) by service.name - Latency anomaly detection:
anomaly(response.time) - Latency percentiles:
percentile(response.time, 50),percentile(response.time, 90),percentile(response.time, 99)
Traffic
- Requests per minute trend:
timeseries(count(request) / 60) - Requests by HTTP status code:
count(request) by http.status_code - Requests by user agent:
count(request) by useragent.name - Requests by endpoint and HTTP method:
count(request) by endpoint, http.method - Requests by response time range:
histogram(response.time) - Requests by geo-location:
count(request) by geoip.country_name - Slow endpoint detection:
top(avg(response.time), 10, endpoint) - Requests by hostname:
count(request) by hostname - Requests by service:
count(request) by service.name - Requests by HTTP version:
count(request) by http.version
Errors
- Error rate trend over time:
timeseries(count(error) / count(request) * 100) - Top error types:
count(error) by errorType - Error rate by geographical region:
count(error) by geoip.country_name - Error rate by application version:
count(error) by application.version - Error rate by HTTP status code:
count(error) by http.status_code - Error rate by service:
count(error) by service.name - Error rate by user agent:
count(error) by useragent.name - Error spike detection:
spike(count(error)) - Error anomaly detection:
anomaly(count(error))
Saturation
- CPU utilization across hosts:
avg(cpu.usage) by host - Memory utilization across hosts:
avg(memory.usage) by host - Disk utilization across hosts:
avg(disk.usage) by host - Network utilization across hosts:
avg(network.usage) by host - CPU utilization by geographical region:
avg(cpu.usage) by geoip.country_name - Memory utilization by geographical region:
avg(memory.usage) by geoip.country_name - Disk utilization by geographical region:
avg(disk.usage) by geoip.country_name - Network utilization by geographical region:
avg(network.usage) by geoip.country_name